|
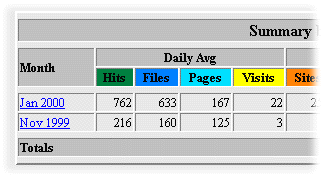
The first page of your statistics shows a summary chart and table by month of visitors to your site. On the left hand side of the summary table is a link for each month. Click on the month you require and you will be taken to the statistics page for that month.
You will now be presented with your site statistics for an individual month. The tables and graphs are shown below with an explanation of the information listed. Monthly Statistics
This table shows the monthly statistics for all the activity on your site.
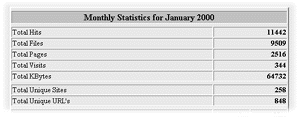
The difference between HITS and FILES is HITS is the total number of HTTP requests that the server received during the reporting period. Any request made to the server is considered a hit. Whereas FILES is the number of hits that actually resulted in something being sent back to the user, such as an HTML page or image. Total Files and the 200 - OK totals should be the same. If you add up the totals in the Hits by Response Code section, it should be the same as the Total Hits. Daily Usage
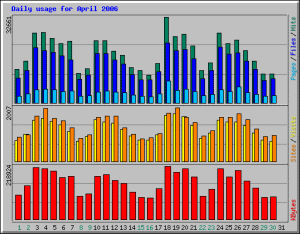
This chart shows the daily usage for activity on your site.
 Daily Statistics
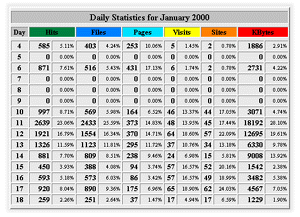
This table shows a detailed breakdown of activity for each day of the month.
 Hourly Usage
This chart shows a general breakdown of activity for each hour during the month.
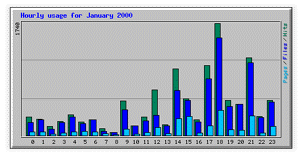
If the highest period of activity is between 10am and 19pm it can be assumed that this is visitors from the UK. Whereas peaks in the 19pm to 03am period can be assumed to be from the Far East and America. Cross referencing this chart with the Visitors by Country graph can confirm this. Hourly Statistics
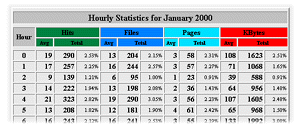
This table shows a detailed breakdown of activity for each hour during the month.
 Top 30
This table shows the 30 most requested files on your site.
 Top 10
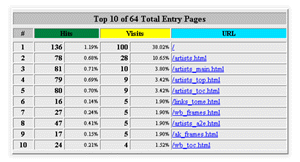
This table shows the top 10 entry pages on your site.
 Entry Pages
This table shows the pages by which visitors entered your site.
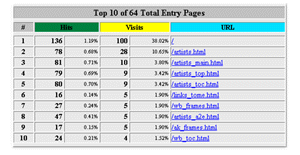
This table shows the pages which visitors entered your site. This can be useful if you have been promoting a particular page and want to know how many visitors have entered your site through the page. It should be noted that if the entry page is part of a frameset each page of the frameset will be listed individually. Exit Pages
This table shows the pages by which visitors left your site.
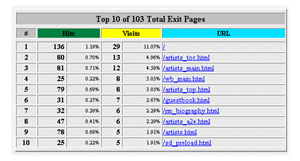
This table shows the pages which visitors have left your site. Knowing which page visitors left from can help you identify potential problems with these pages. Top 30 Visitors
This table shows the 30 most frequent visitors to your site.
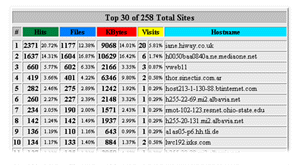
Using the hostname of a visitor can help you track repeat visitors to your site. In general the higher the Files figure then the more pages the visitor has requested which means that they have visited more pages on your site. Top 10 Kilobytes
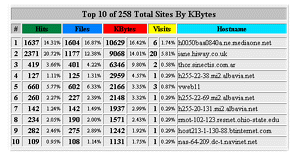
This table shows the top 10 visitors to your site ranked by the kilobytes served to them.
 Visitors By Country
This chart shows which country you site visitors are from.
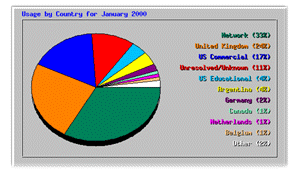
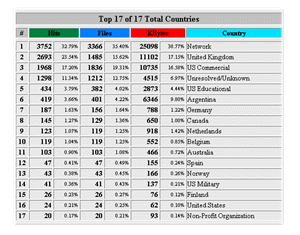
This graph shows geographical information about visitors to your site. This information can be useful if you are promoting your site in a specific region and want feedback on the promotion. The Network category covers visitors who connect to the Internet through a network. This can include business's and educational institutes. Visitors by Country in Detail
This table shows detailed information about which country your site visitors are from.
| 


